Top Realtors and Real Estate Agents in Rochester, MN
Rankings based on verified MLS transaction data. Last updated September 2026. No pay-to-play.
Find your Rochester agent
Tell us where you are and our algorithm matches you with up to three top agents for your home.
- Free
- About 2 minutes
- No obligation

 Top Agent
Top 0.54%
in Rochester, MN
$176.7M
All-Time Sales
$200K - $1.5M
Price Range
 Top Agent
Top 0.76%
in Rochester, MN
$278.4M
All-Time Sales
$170K - $4.2M
Price Range
3%
Negotiated Off List
 Top Agent
Top 1.08%
in Rochester, MN
$102.9M
All-Time Sales
$220K - $1.2M
Price Range
5%
Negotiated Off List
 Top Agent
Top 1.19%
in Rochester, MN
$86.5M
All-Time Sales
$210K - $1.1M
Price Range
 Top Agent
Top 4.1%
in Rochester, MN
$30.5M
All-Time Sales
$170K - $640K
Price Range
 Top Agent
Top 4.21%
in Rochester, MN
$30.3M
All-Time Sales
$130K - $420K
Price Range
 Top Agent
(2071)
Ryan O'Neill
The Minnesota Real Estate Team of RE/MAX Advantage Plus
23 Years of experience
1,776+ Sales in the last 12 months
Top 7.34%
in Rochester, MN
$4.35B
All-Time Sales
$230K - $26M
Price Range
6%
Negotiated Off List
 Top Agent
Top 7.67%
in Rochester, MN
$120M
All-Time Sales
$150K - $1.1M
Price Range
9%
Negotiated Off List
 Top Agent
Top 15.01%
in Rochester, MN
$157.6M
All-Time Sales
$210K - $880K
Price Range
3%
Negotiated Off List
 Top Agent
Top 15.87%
in Rochester, MN
$262.4M
All-Time Sales
$210K - $23.9M
Price Range
10%
Negotiated Off List
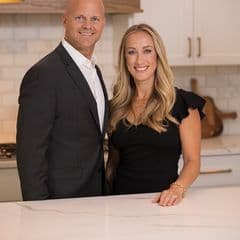 Top Agent
$298.4M
All-Time Sales
$360K - $3.3M
Price Range
3%
Negotiated Off List
 Top Agent
$50.7M
All-Time Sales
$130K - $1.2M
Price Range
4
Sold in Rochester, MN
 Top Agent
$305.8M
All-Time Sales
$290K - $1.9M
Price Range
5%
Negotiated Off List
 Top Agent
Top 16.41%
in Rochester, MN
$96.2M
All-Time Sales
$190K - $1.1M
Price Range
 Top Agent
$182.7M
All-Time Sales
$240K - $1.4M
Price Range
3%
Negotiated Off List
 Top Agent
Top 16.63%
in Rochester, MN
$60.3M
All-Time Sales
$310K - $1.3M
Price Range
 Top Agent
Top 17.6%
in Rochester, MN
$136.5M
All-Time Sales
$290K - $1.5M
Price Range
 Top Agent
Top 17.6%
in Rochester, MN
$107.9M
All-Time Sales
$230K - $1.4M
Price Range
2%
Negotiated Off List
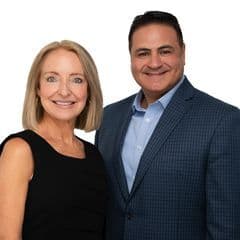 Top Agent
Top 18.68%
in Rochester, MN
$68M
All-Time Sales
$340K - $1.1M
Price Range
 Top Agent
(37)
Jacob Milton
Keller Williams Premier Realty Lake Minnetonka
11 Years of experience
120+ Sales in the last 12 months
Top 18.68%
in Rochester, MN
$114M
All-Time Sales
$230K - $930K
Price Range
 Top Agent
Top 18.68%
in Rochester, MN
$69.1M
All-Time Sales
$250K - $770K
Price Range
 Top Agent
Top 18.68%
in Rochester, MN
$16.6M
All-Time Sales
$220K - $640K
Price Range
Rochester Housing Market Trends
Homes in Rochester take a median 28 days to sell, go for 98.96% of asking, prices are down 0.1% from a year ago. Verified MLS market data through September 2026.
Market temperature
Balanced market
3.1 months of supply. Under 3 favors sellers, over 6 favors buyers.
What homes sell for
$349,733
median sale price
How fast they sell
28 days
median time on market
Supply and competition
3.1 months
of supply on the market
The numbers speak
for Rochester.
Every agent above earned their place with closed sales, not advertising. Tell us about your home and our algorithm picks the Rochester agents whose results fit it.
Rochester agents analyzed for these rankings
days faster: top-ranked agents sell in 24 days, the Rochester market in 28
median sale price in Rochester
Do Top Rochester Agents Sell Faster?
The 22 top-ranked agents on EffectiveAgents in Rochester sell in a median of 24 days, compared with the Rochester market median of 28 days on market.
About 4 days faster (14% quicker than the Rochester market)
Median days to sale reported by the top-ranked Rochester agents on EffectiveAgents, compared with the Rochester market median days on market. Agent figures reflect each agent's reported sales history.
When Is the Best Time to Sell a House in Rochester?
Based on the last 24 months of verified MLS market data, homes in Rochester sell fastest and closest to asking when they go under contract in May. To hit that window, plan to list around April.
Median days on market by month (shorter is faster)
May
Best month to sell
16 days
Typical time on market
100.3%
Of asking price
Seasonal averages from the last 24 months of Rochester, MN sales. Individual results vary with price, condition, and how the broader market moves. A local agent can pinpoint the right timing for your home.
Home Values by Neighborhood in Rochester
Median home values across Rochester, MN neighborhoods, with the change over the past five years.
Folwell
+57% over 5 years
$391K
Glendale
+48% over 5 years
$365K
Northwest Rochester
+58% over 5 years
$341K
Lincolnshire-Arbor Glen
+57% over 5 years
$339K
Apple Hill
+62% over 5 years
$292K
Manor Park
+65% over 5 years
$284K
Meadow Park
+76% over 5 years
$253K
Elton Hills
+65% over 5 years
$251K
John Adams
+64% over 5 years
$249K
Median home values from verified market data; five-year change shown where available.
What These Numbers Mean for Rochester Buyers and Sellers
The Housing Market Trends module above shows a Rochester market where speed and pricing discipline coexist. With a median sale price of $349,733 moving -0.1% year over year and homes leaving the market in a median of 28 days, the tempo favors prepared participants on both sides. Only 3.1 months of supply sits against 468 active listings, a level that historically tilts leverage toward sellers, and the 98.96% sale-to-list ratio confirms that well-positioned homes are closing at or very near asking.
The competitive indicators tell a more nuanced story. 37.6% of homes go under contract within two weeks and 23.0% sell above list, yet 40.7% of listings record a price reduction before selling. That split means correctly priced homes move fast while overreaches stall and cut. For a buyer, the practical read is to move decisively on fresh, accurately priced listings (where competition is real) but to negotiate harder on properties that have already logged a reduction or lingered past the 28 day median. For a seller, the data argues for pricing at market from day one rather than testing a premium, since the reduction rate shows the market corrects ambitious pricing quickly.
With 396 pending sales and 509 new listings entering monthly, turnover is steady rather than frantic. Navigating a market this bifurcated rewards local judgment, and among the 926 licensed agents active here, the difference between one who prices to the day-one competition and one who chases the market shows up directly in your net proceeds.
What Rochester Home Prices Mean for You
Understanding the true cost of homeownership in Rochester goes beyond the listing price. These calculators break down what today's market conditions mean for your budget, your timeline, and your negotiating position.
| Median home price | $349,733 |
| Down payment (20%) | $69,947 |
| Loan amount | $279,786 |
| Monthly payment (PITI) | $2,547 |
Based on 28% debt-to-income ratio, 7.40% mortgage rate (as of October 15, 2026), 30-year fixed loan, 1.15% property tax rate, $275/mo insurance. Actual requirements vary by lender.
Based on $349,733 median home price with 20% down at 7.40% (as of October 15, 2026) for 30 years. Property tax estimated at 1.15% of home value.
Year-over-year data reflects the most recent rolling period from Rochester MLS records. Prior year values calculated from current figures and published YoY changes.
What to Look for in a Rochester Realtor
Choosing an agent on name recognition or a billboard tells you little about how they will perform on your specific transaction. Verified production data does. In Rochester, EffectiveAgents has analyzed 1,725 transactions to rank 42 agents out of the 926 licensed locally. Our top-ranked agent, Julie Fink at RE/MAX Results, has closed 705 transactions with $174.8M in all-time sales volume, a track record that matters when 23.0% of homes sell above list and negotiation experience directly shapes your final number. That volume spans the range of Rochester submarkets, from the established streets of Historic Southwest and Kutzky Park to the family-oriented blocks of Elton Hills, where pricing to the day-one buyer pool determines whether you land above or below asking. When you review candidates, look past the star rating alone and read for patterns across reviews: consistency on communication, pricing accuracy, and how deals held together under contract are far more telling than any single testimonial or a large but unfocused review count.
How We Rank Rochester Real Estate Agents
Our rankings are built from verified MLS transaction data, not advertising spend. For every agent we analyze more than fifteen performance signals, including sales volume in your city and zip code, recent and all-time transactions, days on market, negotiation results (how far above or below list price an agent's clients actually close), price-point fit, and verified reviews. The agents shown first are those whose verified results put them at the top of the Rochester market today.
Agents cannot pay for placement in these rankings. The underlying data refreshes as new closed transactions are reported, so rankings shift with real market performance. Learn how we rank agents.
926
agents analyzed
15+
performance signals
$0
paid for placement
Rankings reviewed by Kevin Stuteville, Licensed Florida Real Estate Broker (License BK3068131), Founder of EffectiveAgents.
Data last updated: September 2026
Rochester Real Estate Agent FAQs
Who is the best real estate agent in Rochester, MN?
The top-ranked agent in Rochester, MN by verified production is Julie Fink at RE/MAX Results, with 705 closed transactions and $174.8M in all-time sales volume. EffectiveAgents does not rank on advertising or self-reported claims. We analyzed 1,725 local transactions and measured outcomes across the 926 licensed agents in the market to surface the 42 who perform most consistently. The right fit still depends on your property type and neighborhood, so compare the shortlist against your specific needs before deciding.
How were these Rochester real estate agents ranked?
Rankings are built from verified MLS transaction data. We analyze more than fifteen performance signals for every agent, including sales volume in your city and zip code, recent and all-time transactions, days on market, negotiation results, price-point fit, and verified reviews. Agents cannot pay for placement.
How many real estate agents are in Rochester?
Our data covers 926 real estate agents serving the Rochester area. The count represents agents with transaction activity recorded in our Rochester market data, not simply everyone holding a license.
What does the median sale price in Rochester mean for sellers?
Rochester's median sale price is $349,733 as of September 2026. Half of recent sales closed above that figure and half below. It is a useful baseline for understanding the market, but an experienced local agent will price your home against comparable recent sales in your neighborhood, not the citywide median.
How long does it take to sell a house in Rochester?
Homes in Rochester currently sell in a median of 28 days, with market time showing a +7 days change from a year ago. That median masks a wide spread: 37.6% of homes go under contract within two weeks, while listings that record one of the 40.7% price reductions typically take considerably longer. Your timeline depends on pricing accuracy from day one, condition, location, and how your listing compares to the 509 new listings competing for buyers each month. Pricing to the market at launch is the single largest factor in a faster sale.
Does it cost anything to use EffectiveAgents?
No. EffectiveAgents is free for home buyers and sellers, with no obligation to work with any agent we match you with.
Do agents pay to be ranked or featured?
No. Agents cannot pay for placement anywhere in these rankings. Positions are earned from verified transaction performance only.
What commission do Rochester realtors charge?
Commissions are negotiable and vary by agent, service level, and transaction. There is no set rate, and recent industry changes have made commission structures more flexible than ever. Discuss the structure directly with your agent before signing a listing or buyer agreement.
Should I use a local Rochester agent or a national brand?
The individual agent matters more than the brand on the sign. Offices within the same national franchise vary widely in performance, and the agent you hire, not the logo, prices your home, negotiates your contract, and manages your closing. A strong local agent brings firsthand knowledge of Rochester neighborhoods, pricing patterns, and buyer activity. Compare agents on verified local results such as recent sales, days on market, and negotiation outcomes rather than name recognition.
What questions should I ask a Rochester realtor before hiring them?
Ask how many homes they have closed in Rochester in the past year, what their average sale-to-list ratio is, and how much of their business is in your neighborhood and price range. Ask how they will market your home or find you listings, and how often they will communicate. Strong agents answer with specifics. Verified transaction data is the fastest way to confirm what you hear.
Top Realtors by Neighborhood in Rochester, MN
Nearby Cities
Learn more about top real estate agents in other cities near Rochester, MN

Free Real Estate Calculators
Planning a move in Rochester? Run the numbers first.


In Rochester